Difference between revisions of "Development"
(→File-based zpools) |
(→File-based zpools) |
||
| Line 319: | Line 319: | ||
errors: No known data errors | errors: No known data errors | ||
| + | </syntaxhighlight> | ||
| + | |||
| + | * test ZFS features, find bugs, ... | ||
| + | |||
| + | * export zpool: | ||
| + | <syntaxhighlight lang="bash"> | ||
| + | $ sudo zpool export tank | ||
| + | </syntaxhighlight> | ||
| + | |||
| + | * detach raw images: | ||
| + | <syntaxhighlight lang="bash"> | ||
| + | $ hdiutil detach disk2 | ||
| + | "disk2" unmounted. | ||
| + | "disk2" ejected. | ||
| + | $ hdiutil detach disk3 | ||
| + | "disk3" unmounted. | ||
| + | "disk3" ejected. | ||
</syntaxhighlight> | </syntaxhighlight> | ||
Revision as of 22:48, 2 June 2014
You should also familiarize yourself with the project roadmap so that you can put the technical details here in context.
Contents
Kernel
Debugging with GDB
Dealing with panics.
Apple's documentation: https://developer.apple.com/library/mac/documentation/Darwin/Conceptual/KEXTConcept/KEXTConceptDebugger/debug_tutorial.html
Boot target VM with
$ sudo nvram boot-args="-v keepsyms=y debug=0x144"
Make it panic.
On your development machine, you will need the Kernel Debug Kit. Download it from Apple here.
$ gdb /Volumes/Kernelit/mach_kernel
(gdb) source /Volumes/KernelDebugKit/kgmacros
(gdb) target remote-kdp
(gdb) kdp-reattach  192.168.30.133   # obviously use the IP of your target / crashed VM
(gdb) showallkmods
Find the addresses for ZFS and SPL modules.
^Z to suspend gdb, or, use another terminal
^Z
$ sudo kextutil -s /tmp -n \
-k /Volumes/KernelDebugKit/mach_kernel \
-e -r /Volumes/KernelDebugKit module/zfs/zfs.kext/ \
../spl/module/spl/spl.kext/
Then resume gdb, or go back to gdb terminal.
$ fg
(gdb) set kext-symbol-file-path /tmp
(gdb) add-kext /tmp/spl.kext
(gdb) add-kext /tmp/zfs.kext
(gdb) bt
Debugging with LLDB
$ echo "settings set target.load-script-from-symbol-file true" >> ~/.lldbinit
$ lldb /Volumes/KernelDebugKit/mach_kernel
(lldb) kdp-remote  192.168.30.146
(lldb) showallkmods
(lldb) addkext -F /tmp/spl.kext/Contents/MacOS/spl 0xffffff7f8ebb0000   (Address from showallkmods)
(lldb) addkext -F /tmp/zfs.kext/Contents/MacOS/zfs 0xffffff7f8ebbf000
Then follow the guide for GDB above.
Non-panic
If you prefer to work in GDB, you can always panic a kernel with
$ sudo dtrace -w -n "BEGIN{ panic();}"
But this was revealing:
$ sudo /usr/libexec/stackshot -i -f /tmp/stackshot.log
$ sudo symstacks.rb -f /tmp/stackshot.log -s -w /tmp/trace.txt
$ less /tmp/trace.txt
Note that my hang is here:
PID: 156
    Process: zpool
    Thread ID: 0x4e2
    Thread state: 0x9 == TH_WAIT |TH_UNINT
    Thread wait_event: 0xffffff8006608a6c
    Kernel stack:
    machine_switch_context (in mach_kernel) + 366 (0xffffff80002b3d3e)
      0xffffff800022e711 (in mach_kernel) + 1281 (0xffffff800022e711)
        thread_block_reason (in mach_kernel) + 300 (0xffffff800022d9dc)
          lck_mtx_sleep (in mach_kernel) + 78 (0xffffff80002265ce)
            0xffffff8000569ef6 (in mach_kernel) + 246 (0xffffff8000569ef6)
              msleep (in mach_kernel) + 116 (0xffffff800056a2e4)
                0xffffff7f80e52a76 (0xffffff7f80e52a76)
                  0xffffff7f80e53fae (0xffffff7f80e53fae)
                    0xffffff7f80e54173 (0xffffff7f80e54173)
                      0xffffff7f80f1a870 (0xffffff7f80f1a870)
                        0xffffff7f80f2bb4e (0xffffff7f80f2bb4e)
                          0xffffff7f80f1a9b7 (0xffffff7f80f1a9b7)
                            0xffffff7f80f1b65f (0xffffff7f80f1b65f)
                              0xffffff7f80f042ee (0xffffff7f80f042ee)
                                0xffffff7f80f45c5b (0xffffff7f80f45c5b)
                                  0xffffff7f80f4ce92 (0xffffff7f80f4ce92)
                                    spec_ioctl (in mach_kernel) + 157 (0xffffff8000320bfd)
                                      VNOP_IOCTL (in mach_kernel) + 244 (0xffffff8000311e84)
It is a shame that it only shows the kernel symbols, and not inside SPL and ZFS, but we can ask it to load another sym file. (Alas, it cannot handle multiple symbols files. Fix this Apple.)
$ sudo kextstat #grab the addresses of SPL and ZFS again
$ sudo kextutil -s /tmp -n -k /Volumes/KernelDebugKit/mach_kernel \
-e -r /Volumes/KernelDebugKit module/zfs/zfs.kext/ ../spl/module/spl/spl.kext/

$ sudo symstacks.rb -f /tmp/stackshot.log -s -k /tmp/net.lundman.spl.sym
              0xffffff800056a2e4 (0xffffff800056a2e4)
                spl_cv_wait (in net.lundman.spl.sym) + 54 (0xffffff7f80e52a76)
                  taskq_wait (in net.lundman.spl.sym) + 78 (0xffffff7f80e53fae)
                    taskq_destroy (in net.lundman.spl.sym) + 35 (0xffffff7f80e54173)
                      0xffffff7f80f1a870 (0xffffff7f80f1a870)

$ sudo symstacks.rb -f /tmp/stackshot.log -s -k /tmp/net.lundman.zfs.sym
                    0xffffff7f80e54173 (0xffffff7f80e54173)
                      vdev_open_children (in net.lundman.zfs.sym) + 336 (0xffffff7f80f1a870)
                        vdev_root_open (in net.lundman.zfs.sym) + 94 (0xffffff7f80f2bb4e)
                          vdev_open (in net.lundman.zfs.sym) + 311 (0xffffff7f80f1a9b7)
                            vdev_create (in net.lundman.zfs.sym) + 31 (0xffffff7f80f1b65f)
                              spa_create (in net.lundman.zfs.sym) + 878 (0xffffff7f80f042ee)
Voilà!
Memory leaks
In some cases, you may suspect memory issues, for instance if you saw the following panic:
panic(cpu 1 caller 0xffffff80002438d8): "zalloc: \"kalloc.1024\" (100535 elements) retry fail 3, kfree_nop_count: 0"@/SourceCache/xnu/xnu-2050.7.9/osfmk/kern/zalloc.c:1826
To debug this, you can attach GDB and use the zprint command:
(gdb) zprint
ZONE                   COUNT   TOT_SZ   MAX_SZ   ELT_SZ ALLOC_SZ         TOT_ALLOC         TOT_FREE NAME
0xffffff8002a89250   1620133  18c1000  22a3599       16     1000         125203838        123583705 kalloc.16 CX
0xffffff8006306c50    110335   35f000   4ce300       32     1000          13634985         13524650 kalloc.32 CX
0xffffff8006306a00    133584   82a000   e6a900       64     1000          26510120         26376536 kalloc.64 CX
0xffffff80063067b0    610090  4a84000  614f4c0      128     1000          50524515         49914425 kalloc.128 CX
0xffffff8006306560   1070398 121a2000 1b5e4d60      256     1000          72534632         71464234 kalloc.256 CX
0xffffff8006306310    399302  d423000  daf26b0      512     1000          39231204         38831902 kalloc.512 CX
0xffffff80063060c0    100404  6231000  c29e980     1024     1000          22949693         22849289 kalloc.1024 CX
0xffffff8006305e70       292    9a000   200000     2048     1000          77633725         77633433 kalloc.2048 CX
In this case, kalloc.256 is suspect.
Reboot kernel with zlog=kalloc.256 on the command line, then we can use
(gdb) findoldest
oldest record is at log index 393:

--------------- ALLOC  0xffffff803276ec00 : index 393  :  ztime 21643824 -------------
0xffffff800024352e <zalloc_canblock+78>:        mov    %eax,-0xcc(%rbp)
0xffffff80002245bd <get_zone_search+23>:        jmpq   0xffffff80002246d8 <KALLOC_ZINFO_SALLOC+35>
0xffffff8000224c39 <OSMalloc+89>:       mov    %rax,-0x18(%rbp)
0xffffff7f80e847df <zfs_kmem_alloc+15>: mov    %rax,%r15
0xffffff7f80e90649 <arc_buf_alloc+41>:  mov    %rax,-0x28(%rbp)
and indeed, list any index

(gdb) zstack 394

--------------- ALLOC  0xffffff8032d60700 : index 394  :  ztime 21648810 -------------
0xffffff800024352e <zalloc_canblock+78>:        mov    %eax,-0xcc(%rbp)
0xffffff80002245bd <get_zone_search+23>:        jmpq   0xffffff80002246d8 <KALLOC_ZINFO_SALLOC+35>
0xffffff8000224c39 <OSMalloc+89>:       mov    %rax,-0x18(%rbp)
0xffffff7f80e847df <zfs_kmem_alloc+15>: mov    %rax,%r15
0xffffff7f80e90649 <arc_buf_alloc+41>:  mov    %rax,-0x28(%rbp)
How many times was zfs_kmem_alloc involved in the leaked allocs?

(gdb) countpcs 0xffffff7f80e847df
occurred 3999 times in log (100% of records)
At least we know it is our fault.
How many times is it arc_buf_alloc?
(gdb) countpcs 0xffffff7f80e90649
occurred 2390 times in log (59% of records)
Flamegraphs
Huge thanks to BrendanGregg for so much of the dtrace magic.
dtrace the kernel while running a command:
$ sudo dtrace -x stackframes=100 -n 'profile-997 /arg0/ {
    @[stack()] = count(); } tick-60s { exit(0); }' -o out.stacks
It will run for 60 seconds.
Convert it to a flamegraph:
$ ./stackcollapse.pl out.stacks > out.folded
$ ./flamegraph.pl out.folded > out.svg
This is rsync -a /usr/ /BOOM/deletea/ running:

Or running Bonnie++ in various stages:

Create files in sequential order

Stat files in sequential order

Delete files in sequential order
 Create files in sequential order
 IOzone flamegraph
 IOzone flamegraph (untrimmed)
Iozone
Quick peek at how they compare, just to see how much we should improve it by.
HFS+ and ZFS were created on the same virtual disk in VMware. Of course, this is not ideal testing specs, but should serve as an indicator.
The pool was created with
$ sudo zpool create -f -o ashift=12 \
-O atime=off \
-O casesensitivity=insensitive \
-O normalization=formD \
BOOM /dev/disk1
and the HFS+ file system was created with the standard OS X Disk Utility.app, with everything default (journaled, case-insensitive).
Iozone was run with standard automode:
sudo iozone -a -b outfile.xls
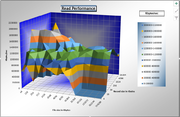 HFS+ read
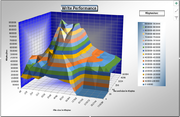 HFS+ write
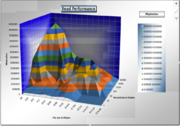 ZFS read
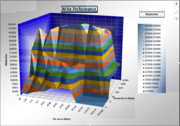 ZFS write
As a guess, writes need to double, and reads need to triple.
VFS
File-based zpools
- create 2 files (each 100 MB) to be used as block devices:
$ dd if=/dev/zero bs=1m count=100 of=vdisk1
$ dd if=/dev/zero bs=1m count=100 of=vdisk2
- attach files as raw disk images:
$ hdiutil attach -imagekey diskimage-class=CRawDiskImage -nomount vdisk1
/dev/disk2
$ hdiutil attach -imagekey diskimage-class=CRawDiskImage -nomount vdisk2
/dev/disk3
- create mirrored zpool:
$ sudo zpool create -f -o ashift=12 -O casesensitivity=insensitive -O normalization=formD tank mirror disk2 disk3
- show zpool:
$ sudo zpool status
  pool: tank
 state: ONLINE
  scan: none requested
config:

	NAME        STATE     READ WRITE CKSUM
	tank        ONLINE       0     0     0
	  mirror-0  ONLINE       0     0     0
	    disk2   ONLINE       0     0     0
	    disk3   ONLINE       0     0     0

errors: No known data errors
- test ZFS features, find bugs, ...
- export zpool:
$ sudo zpool export tank
- detach raw images:
$ hdiutil detach disk2
"disk2" unmounted.
"disk2" ejected.
$ hdiutil detach disk3
"disk3" unmounted.
"disk3" ejected.


