Difference between revisions of "Windows BSOD"
m |
(typo) |
||
| (16 intermediate revisions by 6 users not shown) | |||
| Line 1: | Line 1: | ||
| − | == Windows | + | == Windows Crash Dumps == |
| − | If you do managed to get a Blue Screen Of Death, Windows should in theory write a dump file: | + | Crashdumps can be enabled in Settings > System > Info under "extended system settings" |
| + | If you do managed to get a Blue Screen Of Death (BSOD), Windows should in theory write a crash dump file to: | ||
C:\Windows\MEMORY.DMP | C:\Windows\MEMORY.DMP | ||
| − | + | The dump file can be analyzed with [http://windbg.org WinDbg.exe] | |
| − | + | Debug builds of ZFSin include debugging symbols to assist in dump analysis which are located at: | |
| + | |||
| + | C:\Program Files\OpenZFS On Windows\symbols\ | ||
| + | |||
| + | === WinDbg.exe at the Command Line === | ||
| + | |||
| + | Once installed, WinDbg.exe can be run from a CMD.com or PowerShell terminal with Administrative privileges: | ||
| + | |||
| + | WinDbgX.exe -y ‘C:\Program Files\OpenZFS On Windows\symbols\’ -z C:\Windows\MEMORY.DMP | ||
| + | |||
| + | This will launch the application and you can perform dump analysis with: | ||
| + | |||
| + | kd> !analyze -v | ||
| + | |||
| + | To run the analysis in a single command: | ||
| + | |||
| + | WinDbgX.exe -y ‘C:\Program Files\OpenZFS On Windows\symbols\’ -z C:\Windows\MEMORY.DMP -c !analyze -v | ||
| + | |||
| + | === WinDbg.exe in the GUI === | ||
| + | |||
| + | Launch WinDbg.exe and set the symbol path: | ||
| + | |||
| + | kd> .symfix c:\cache | ||
| + | kd> .sympath+ C:\Program Files\OpenZFS On Windows\symbols | ||
| + | kd> .reload | ||
| + | |||
| + | So that it can load both the symbols from Microsoft, and from the installed Open ZFS directory. | ||
| + | |||
| + | |||
| + | Open the crash dump file with: | ||
| + | |||
| + | File: Open crash dump | ||
| + | C:\Windows\MEMORY.DMP | ||
| + | |||
| + | Perform the analysis: | ||
| + | |||
| + | kd> !analyze -v | ||
| + | |||
| + | Should at least show the stack. | ||
| + | |||
| + | <gallery mode="packed-hover"> | ||
| + | Image:minidump1.png|''Set symbol path'' | ||
| + | Image:minidump2.png|''Add path'' | ||
| + | Image:minidump3.png|''Load crash dump'' | ||
| + | Image:minidump4.png|''Locate minidump'' | ||
| + | Image:minidump5.png|''minidump loading'' | ||
| + | Image:minidump6.png|''analyze with stack'' | ||
| + | </gallery> | ||
| + | |||
| + | === Example Crash report === | ||
| + | |||
| + | A successful crash dump would look something like: | ||
| + | |||
| + | ZFSin!zfs_range_lock_reader+0x290 [c:\src\zfsin\zfsin\zfs\module\zfs\zfs_rlock.c @ 417] C/C++/ASM | ||
| + | ZFSin!zfs_range_lock+0x16d [c:\src\zfsin\zfsin\zfs\module\zfs\zfs_rlock.c @ 453] C/C++/ASM | ||
| + | ZFSin!zil_lwb_commit+0x99f [c:\src\zfsin\zfsin\zfs\module\zfs\zil.c @ 1570] C/C++/ASM | ||
| + | ZFSin!zil_process_commit_list+0x30e [c:\src\zfsin\zfsin\zfs\module\zfs\zil.c @ 2182] C/C++/ASM | ||
| + | ZFSin!zil_commit_writer+0x111 [c:\src\zfsin\zfsin\zfs\module\zfs\zil.c @ 2318] C/C++/ASM | ||
| + | |||
| + | If you get only ZFSin+0x"hex-number" it means it is not reading the debug symbols correctly, to be able to convert the hex-number into a function name. | ||
| + | |||
| + | |||
| + | === Debug Print Buffer === | ||
| + | |||
| + | Windows features a circular debug print buffer which can also be written to disk: | ||
| + | |||
| + | Old | ||
| + | |||
| + | kd> .writemem C:\Users\<your Windows username>\Desktop\cbuf.txt poi(ZFSin!cbuf) L100000 | ||
| + | |||
| + | New | ||
| + | |||
| + | kd> .writemem C:\Users\<your Windows username>\Desktop\cbuf.txt poi(OpenZFS!cbuf) L100000 | ||
| + | |||
| + | Do not worry if you get a message about short write, it just means you have not yet filled the buffer. | ||
| + | |||
| + | This will include -EB- at the end of the buffer. | ||
| + | Do not worry if the rest of the buffer has "@" (nul) symbols, it just means the buffer was not yet full. | ||
| + | |||
| + | Please provide the contents of the dump analysis and cbuf.txt in you ZFSin in your crash-related tickets. | ||
Latest revision as of 12:01, 7 March 2025
Contents
Windows Crash Dumps
Crashdumps can be enabled in Settings > System > Info under "extended system settings" If you do managed to get a Blue Screen Of Death (BSOD), Windows should in theory write a crash dump file to:
C:\Windows\MEMORY.DMP
The dump file can be analyzed with WinDbg.exe
Debug builds of ZFSin include debugging symbols to assist in dump analysis which are located at:
C:\Program Files\OpenZFS On Windows\symbols\
WinDbg.exe at the Command Line
Once installed, WinDbg.exe can be run from a CMD.com or PowerShell terminal with Administrative privileges:
WinDbgX.exe -y ‘C:\Program Files\OpenZFS On Windows\symbols\’ -z C:\Windows\MEMORY.DMP
This will launch the application and you can perform dump analysis with:
kd> !analyze -v
To run the analysis in a single command:
WinDbgX.exe -y ‘C:\Program Files\OpenZFS On Windows\symbols\’ -z C:\Windows\MEMORY.DMP -c !analyze -v
WinDbg.exe in the GUI
Launch WinDbg.exe and set the symbol path:
kd> .symfix c:\cache
kd> .sympath+ C:\Program Files\OpenZFS On Windows\symbols
kd> .reload
So that it can load both the symbols from Microsoft, and from the installed Open ZFS directory.
Open the crash dump file with:
File: Open crash dump
C:\Windows\MEMORY.DMP
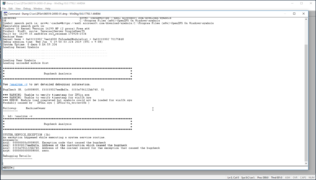
Perform the analysis:
kd> !analyze -v
Should at least show the stack.
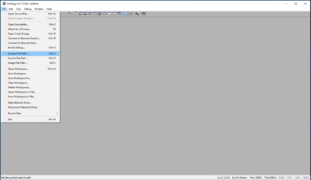
Set symbol path
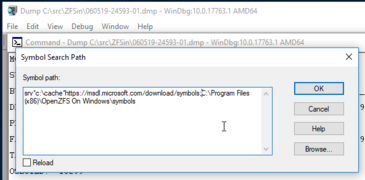
Add path
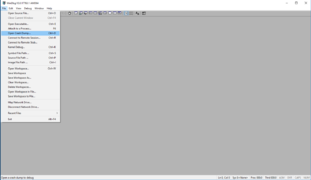
Load crash dump
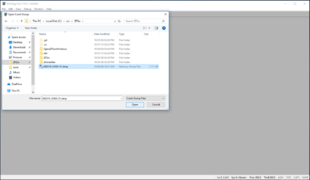
Locate minidump
minidump loading
analyze with stack
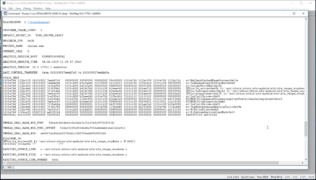
Example Crash report
A successful crash dump would look something like:
 	ZFSin!zfs_range_lock_reader+0x290 [c:\src\zfsin\zfsin\zfs\module\zfs\zfs_rlock.c @ 417]	C/C++/ASM
	ZFSin!zfs_range_lock+0x16d [c:\src\zfsin\zfsin\zfs\module\zfs\zfs_rlock.c @ 453]	C/C++/ASM
	ZFSin!zil_lwb_commit+0x99f [c:\src\zfsin\zfsin\zfs\module\zfs\zil.c @ 1570]	C/C++/ASM
	ZFSin!zil_process_commit_list+0x30e [c:\src\zfsin\zfsin\zfs\module\zfs\zil.c @ 2182]	C/C++/ASM
	ZFSin!zil_commit_writer+0x111 [c:\src\zfsin\zfsin\zfs\module\zfs\zil.c @ 2318]	C/C++/ASM
If you get only ZFSin+0x"hex-number" it means it is not reading the debug symbols correctly, to be able to convert the hex-number into a function name.
Debug Print Buffer
Windows features a circular debug print buffer which can also be written to disk:
Old
kd> .writemem C:\Users\<your Windows username>\Desktop\cbuf.txt poi(ZFSin!cbuf) L100000
New
kd> .writemem C:\Users\<your Windows username>\Desktop\cbuf.txt poi(OpenZFS!cbuf) L100000
Do not worry if you get a message about short write, it just means you have not yet filled the buffer.
This will include -EB- at the end of the buffer. Do not worry if the rest of the buffer has "@" (nul) symbols, it just means the buffer was not yet full.
Please provide the contents of the dump analysis and cbuf.txt in you ZFSin in your crash-related tickets.


